The nascent tweet NFT market is for many a bizarre place. Magically turning Twitter tweets into digital assets with price tags and putting them up for sale is the latest craze in the world of crypto. Some sense an investment opportunity. However, too little is known yet about tweet NFT trades from a financial perspective. Against this backdrop, we provide for the first time exploratory insights on key metrics such as trade volume, profitability, and price determinants. Our analysis is built on a rich dataset sourced from scraping the Web via a custom Python script.
Authors: Philipp Sandner, Christian Flasshoff, Jong-Chan Chung, Jan Steegmüller
Introduction
While dogecoin is chasing one all-time high after another, other hypes in the crypto scene don’t rest. Non-fungible tokens (NFTs) have been a trend throughout 2020 and 2021. A relatively new development in this space is tweet NFTs. The hype around those was spurred by the eye-watering sale of a tweet by Jack Dorsey, the CEO, and co-founder of Twitter, for around US $3 million in March 2021. This article will provide an overview of the foundations of tweet NFTs and give novel insights on current market dynamics.
Foundation: Tweet NFTs
Tweet NFTs are tokenized Twitter tweets. This can be done through various tweet NFT marketplaces such as Valuables by Cent. A Twitter user can log in with her Twitter credentials and convert her tweets into NFTs. Afterwards, these NFTs can be monetized by selling them directly on the marketplace. This is done by accepting a purchase offer, which has to be made by another platform user. After accepting, the unique ownership of the tweet NFT is transferred to the buyer in exchange for the sale price in ETH, while a small brokerage fee is sent to the marketplace operator. If the NFT is involved in a secondary sale, the original creator will also receive a royalty fee, while a potential trader could realize a price gain. These are the different possibilities of realizing profits through tweet NFTs. But where does the value of a tweet NFT come from? One part is explained by expectations of a price appreciation. The remaining part comes from its intrinsic value, although a tweet NFT involves no cash flows for the owner. Simply owning a part of “social media history” or an iconic picture or message from an idol makes tweet NFTs valuable just like an autographed card.
This extremely dynamic market might at first seem confusing and trades may appear as random speculation, so we screened the market to clarify the underlying technology and the market dynamics observed. Thereby, this article provides a comprehensive starting point for anyone interested in crypto and digital assets or tech-enthusiasts, who are simply interested in current trends in the DeFi space.
Data collection and data overview
In order to gain more insights into the tweet NFT market activities on Valuables by Cent, we need to extract relevant data. The NFTs itself are stored on the public Polygon blockchain (0x28009881f0Ffe85C90725B8B02be55773647C64a), while the offer and sales logic of the NFTs are managed by a smart contract deployed on the public Ethereum blockchain (0xE14ab3Ee81aBe340b45Bb26b1B166a7D2dF22585). Both chains allow retrieval of the relevant transactions via JSON RPC endpoints, while the information can be decoded with the help of the corresponding ABIs. Each NFT stored on the Polygon chain includes a unique URI which points to a JSON, which is stored on the v.cent.co server (example). The JSON includes metadata on the tweet, including the tweet id and author identifier. With the help of this information, we were able to enrich the dataset with additional information from the Twitter API (e.g., number of followers, retweets, likes, etc.). In summary, our dataset is sourced from four different sources: Polygon blockchain, Ethereum blockchain, v.cent.co, and Twitter API.
Our dataset comprises 12,131 individual records. Each record represents either a minting event, a bid, or a sale of a tweet NFT. Aggregating the count of each category yields the following figure:
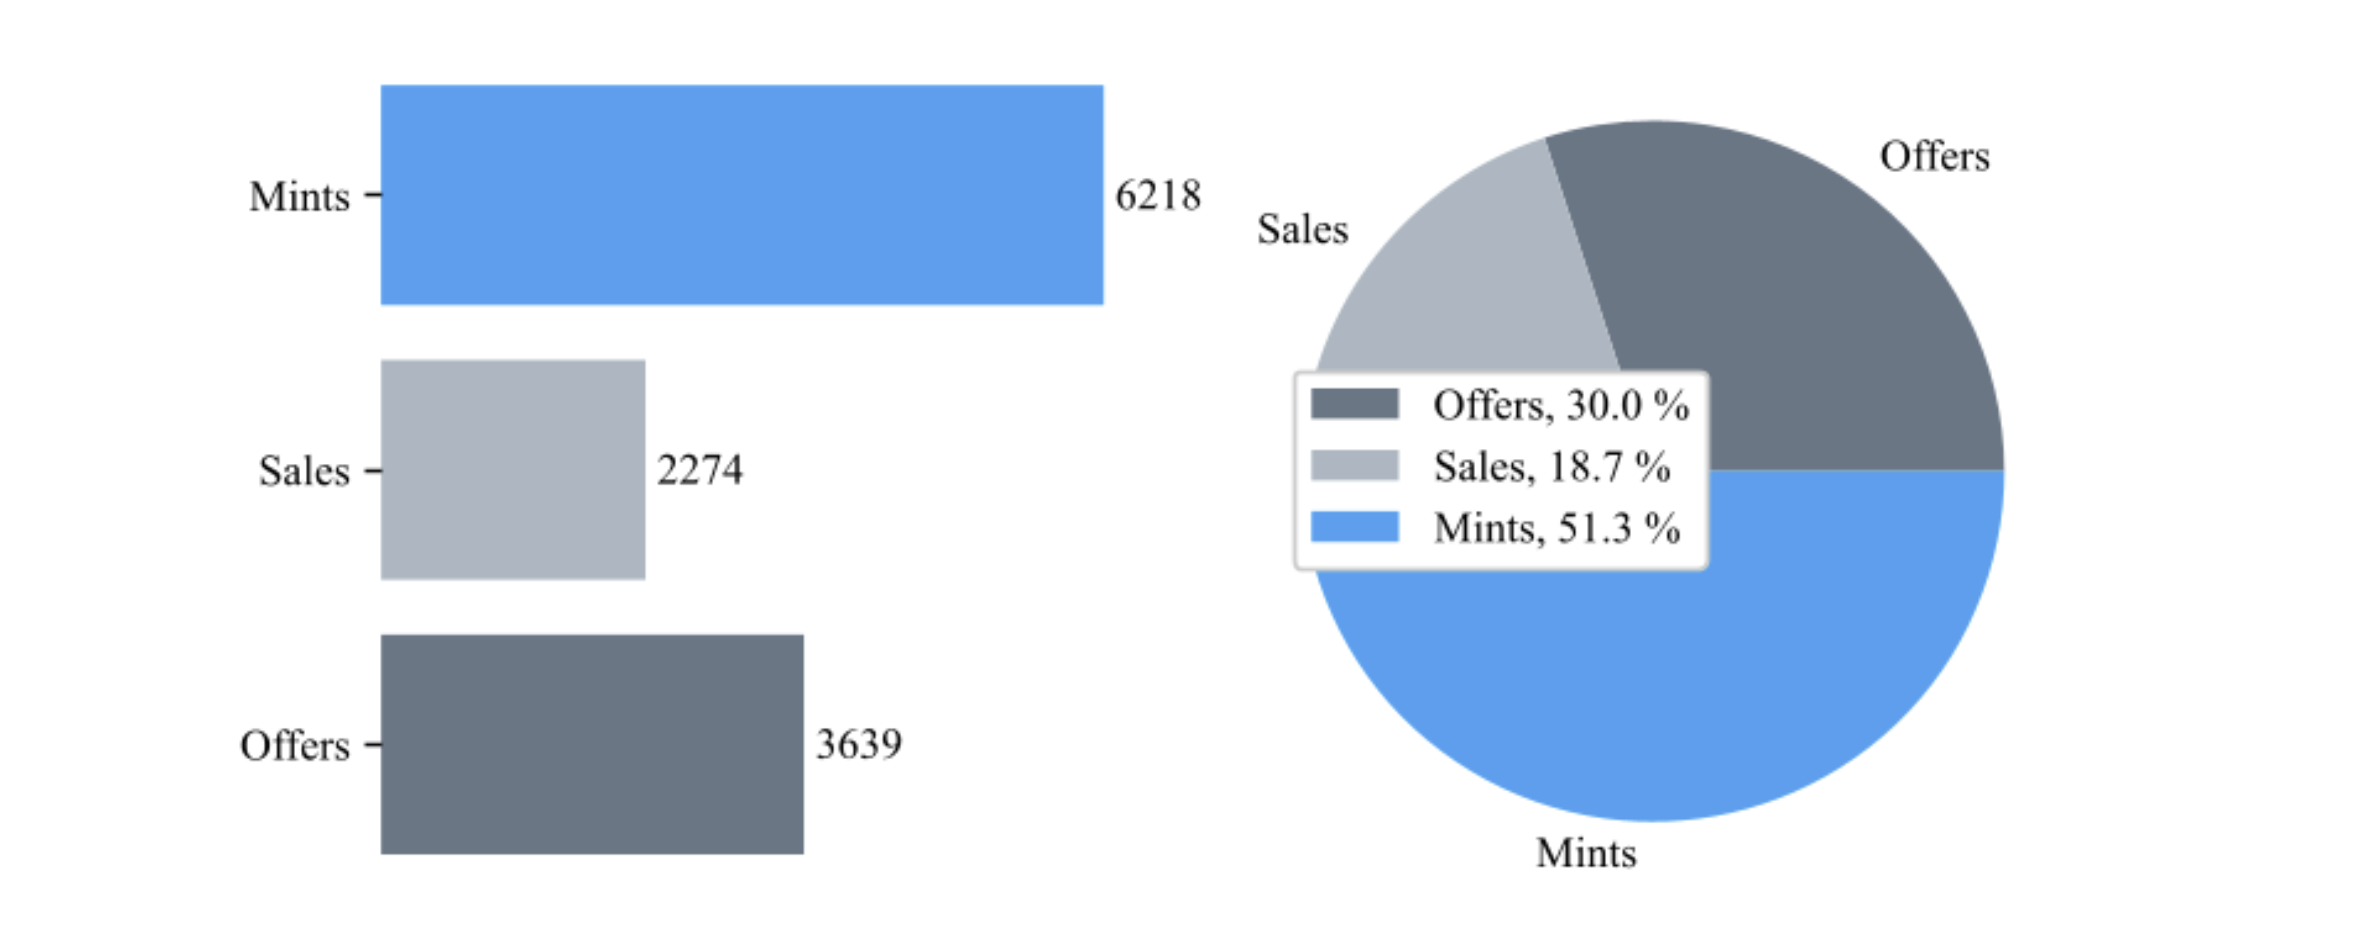
Figure 1: Mints, sales, and offers in absolute and relative terms
While the majority of the original data set relates to minting events, we are dropping these observations for subsequent analyses as they lack information about prices in contrast to sale and offer events. Only through sales of and offers for tweet NFTs does the market provide clues about the valuation of tweet NFTs. In the following, particular attention is paid to realized gains, and therefore we are going to focus on the sales data subset which has 2,274 entries in total, i.e., 2,274 changes of ownership of tweet NFTs.
The first tweet: a special outlier
Ahead of digging into the sales data set though, it merits putting an extraordinary tweet NFT out of the way that would otherwise overly skew the sale prices distribution and bias our statistics. If you have followed the recent tweet NFT news you can guess which tweet we are alluding to. Twitter CEO Jack Dorsey’s very first tweet (2006), sold for a whopping 1,630.58 ETH, equaling US $5.8 million (referencing the ETH/USD exchange rate at the time of writing). Compare this to the second most expensive tweet NFT sold for 14.34 ETH and to measures of central tendency at 0.01 ETH and 0.075 ETH for the median and mean sale price respectively. Moreover, the Jack Dorsey tweet NFT makes up 90.56% of the total sales volume at 1,800.61 ETH. To add yet another perspective, the number of sales for NFT tweets sold below or equal to 0.1 ETH represents 92.13% of all sales. However, they represent only 1.9% of the total sales volume. This underscores how much of an outlier the Jack Dorsey tweet is and justifies its removal from our data. After dropping the outlier, the distribution of tweet NFT sale prices looks like this (still skewed to the right):
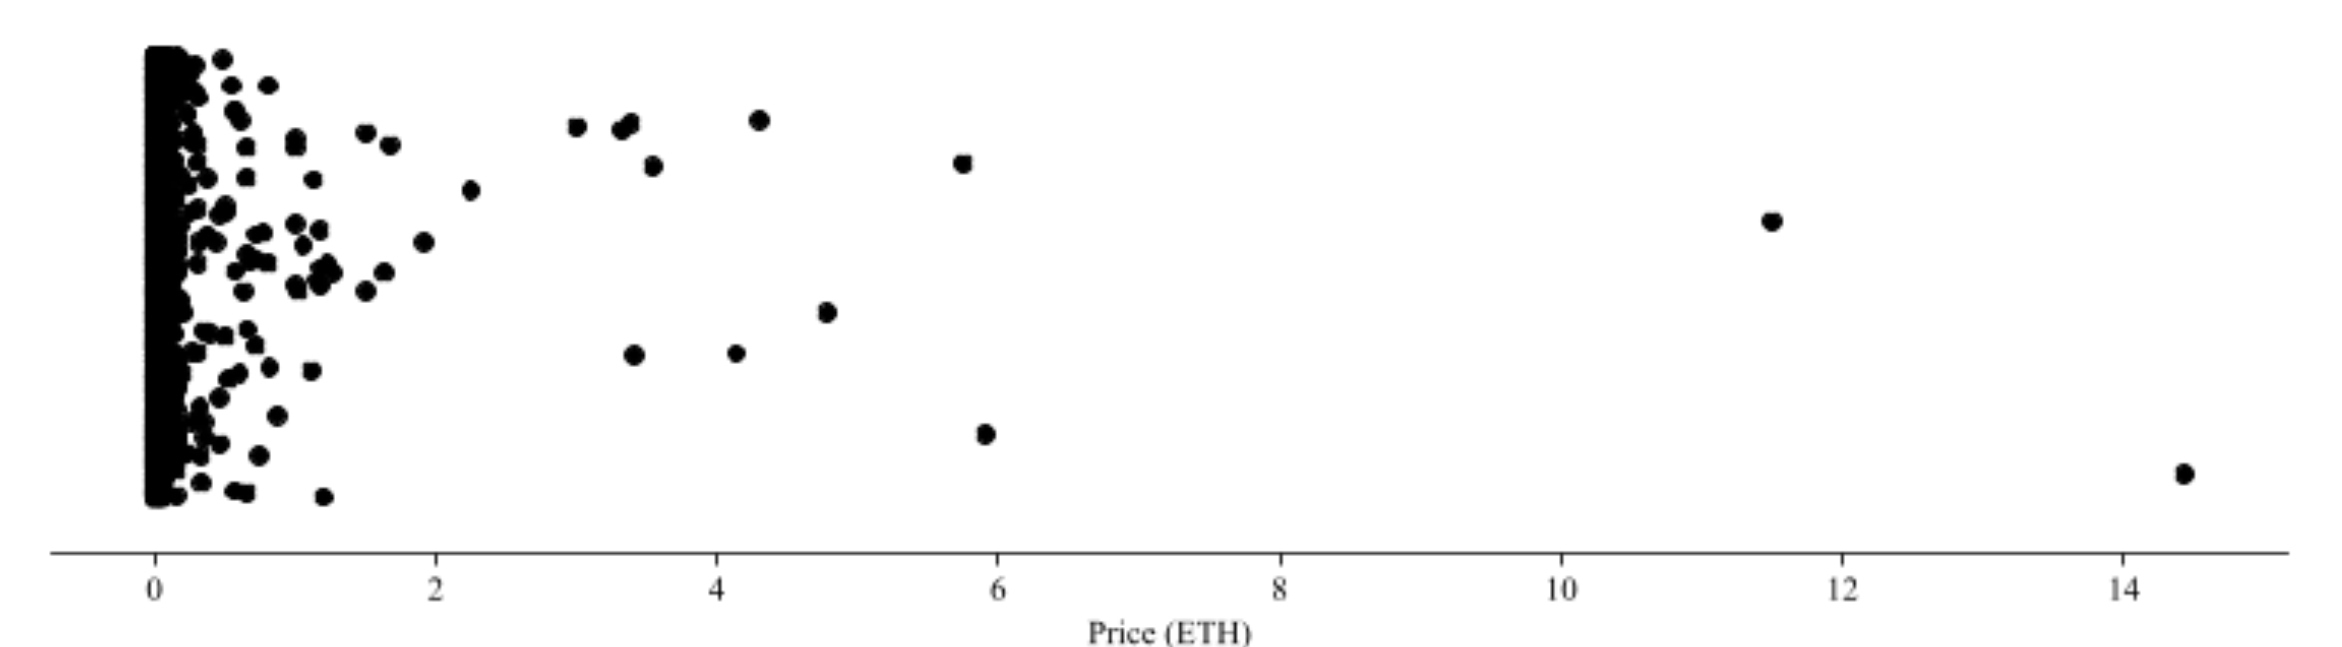
Figure 2: Distribution of sale prices (max sale price removed)
An illiquid secondary market
Turning to the secondary market for tweet NFTs, we count 84 tweet NFTs that have been sold at least twice. The secondary sale price median is 0.0019 ETH and the mean is 0.025 ETH, again implying that the sale price distribution is right-skewed. Two tweet NFTs were sold three times.
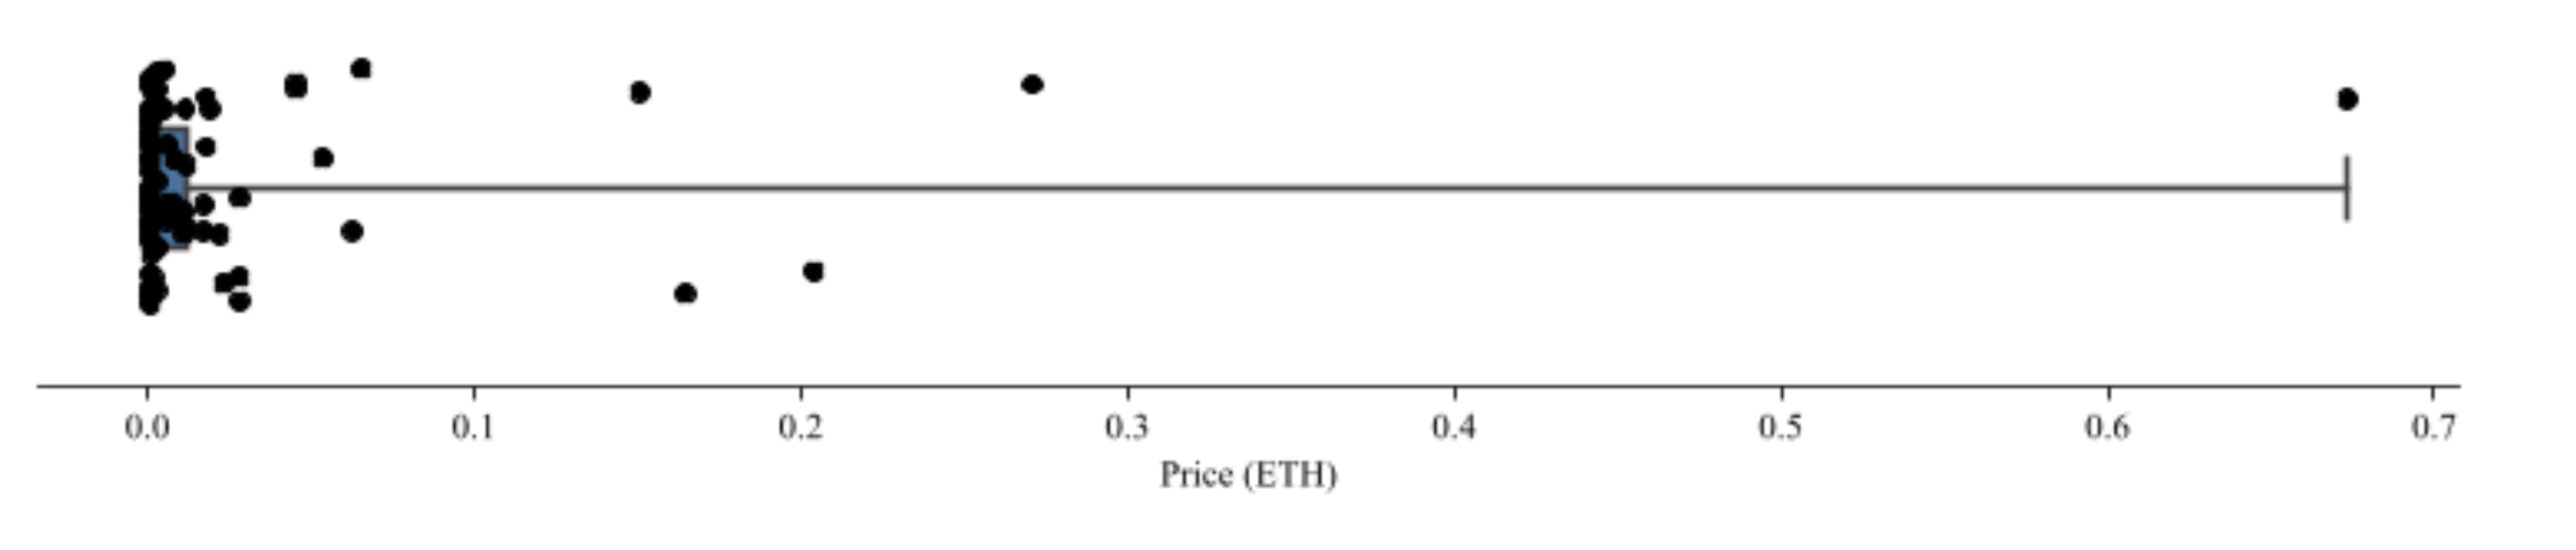
Figure 3: Distribution of secondary sale prices
We want to know whether secondary sales were sold at a premium or at a discount. After identifying secondary sale tweet NFTs we matched each of their secondary sale prices with their first-time sale price and calculated the difference.
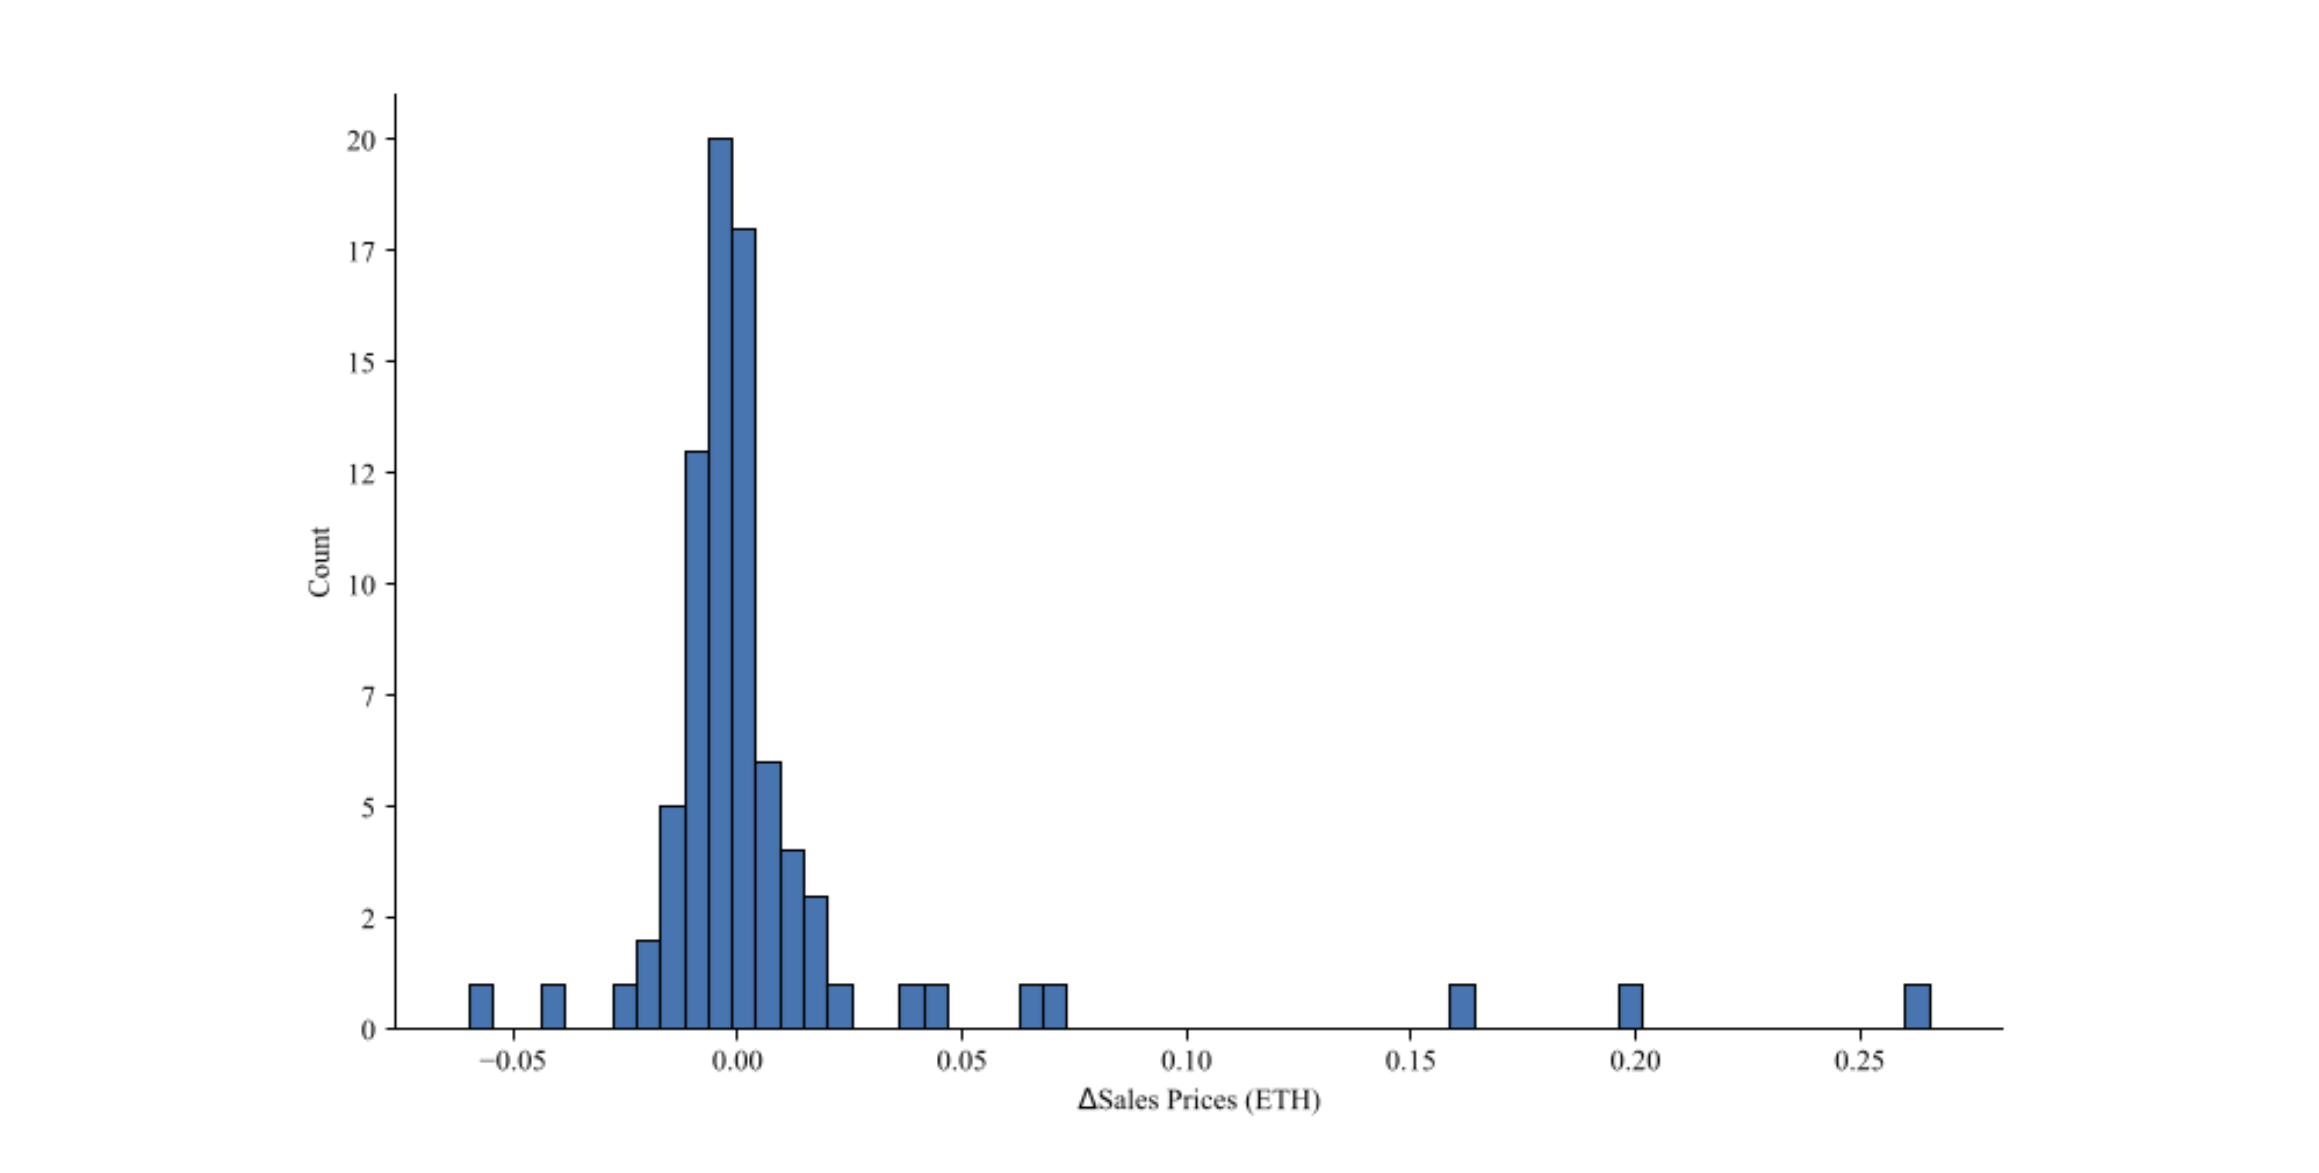
Figure 4: Absolute sales price difference secondary sales
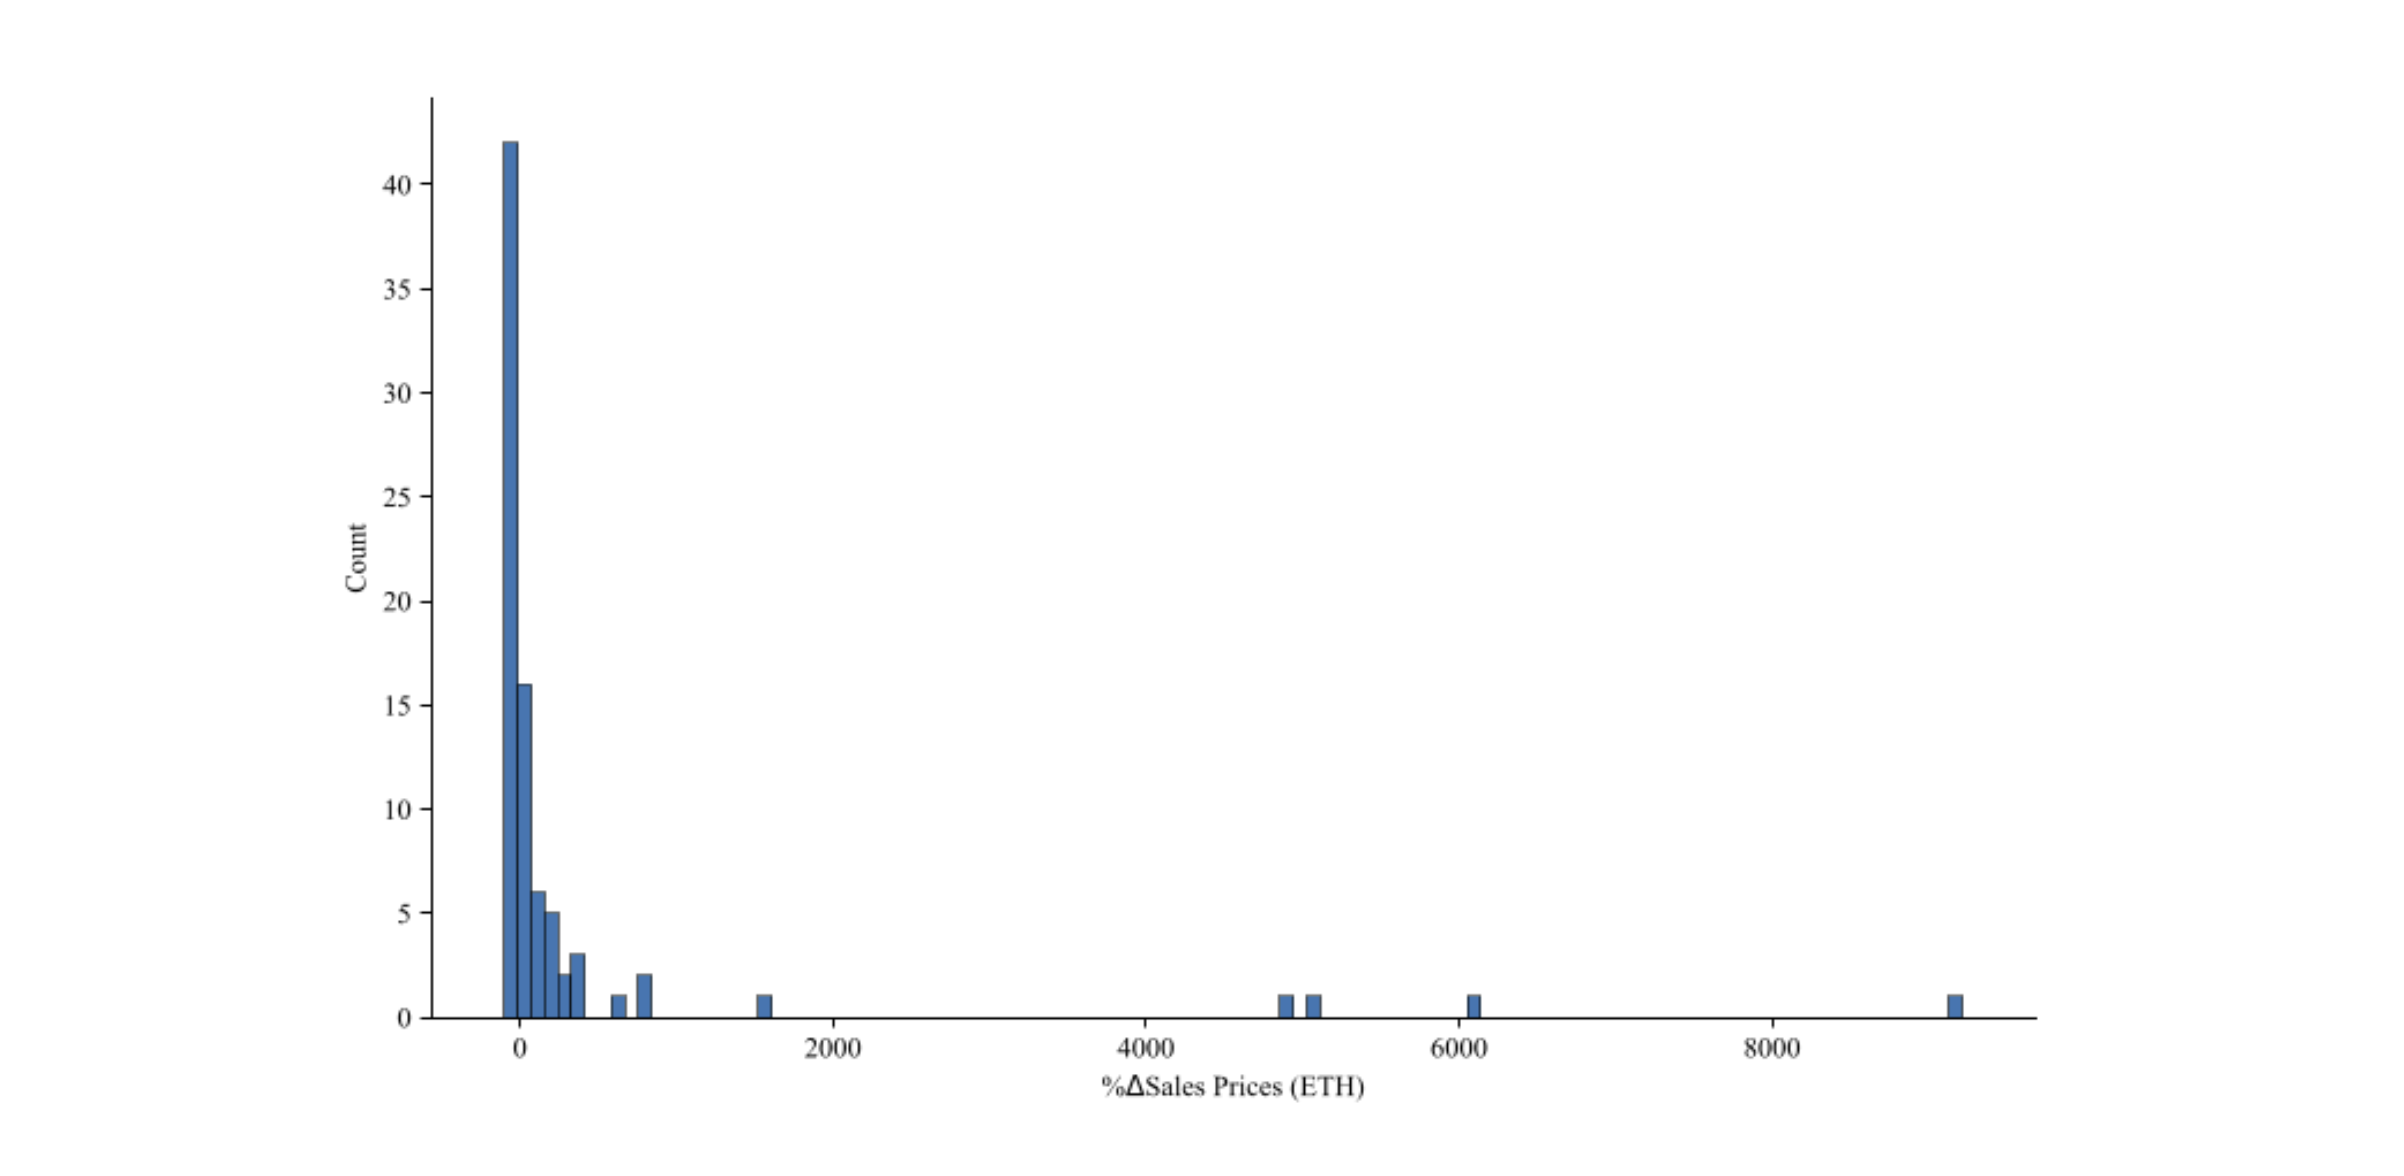
Figure 5: Relative sales price increases/decreases
While Figure 4 illustrates that profit and losses in absolute terms are more or less normally distributed, Figure 5 shows that gains were considerably larger than losses in terms of percent changes.
The message here seems to be that the tweet NFTs secondary market can be highly lucrative for a lucky few in possession of special tweet NFTs. However, the bottom line is that the secondary market is very illiquid at the moment with only 84 secondary trades compared to more than 2000 first-time trades. Only a fraction of all tweet NFTs is resold.
Can we predict sale prices?
In this section, we inspect the associations between variables in our sales data set. To start with, we look at correlations between numerical variables drawing on a heatmap (Figure 6) to visualize the strength of correlations in a matrix. This can be useful to select potential independent variables to regress the dependent variable on in a later step (we want to predict sale prices).

Figure 6: Correlation heatmap (Pearson correlation coefficients)
We can see that Sale Price (ETH) is only weakly correlated with the other seven numeric variables, although one could have expected it to move more closely in conjunction with the number of Tweet likes or Followers. The weak correlation is confirmed in Figure 7, depicting a scatterplot between the tweet creator’s followers count and tweet NFT’s sale price (zoomed in on low sale prices):
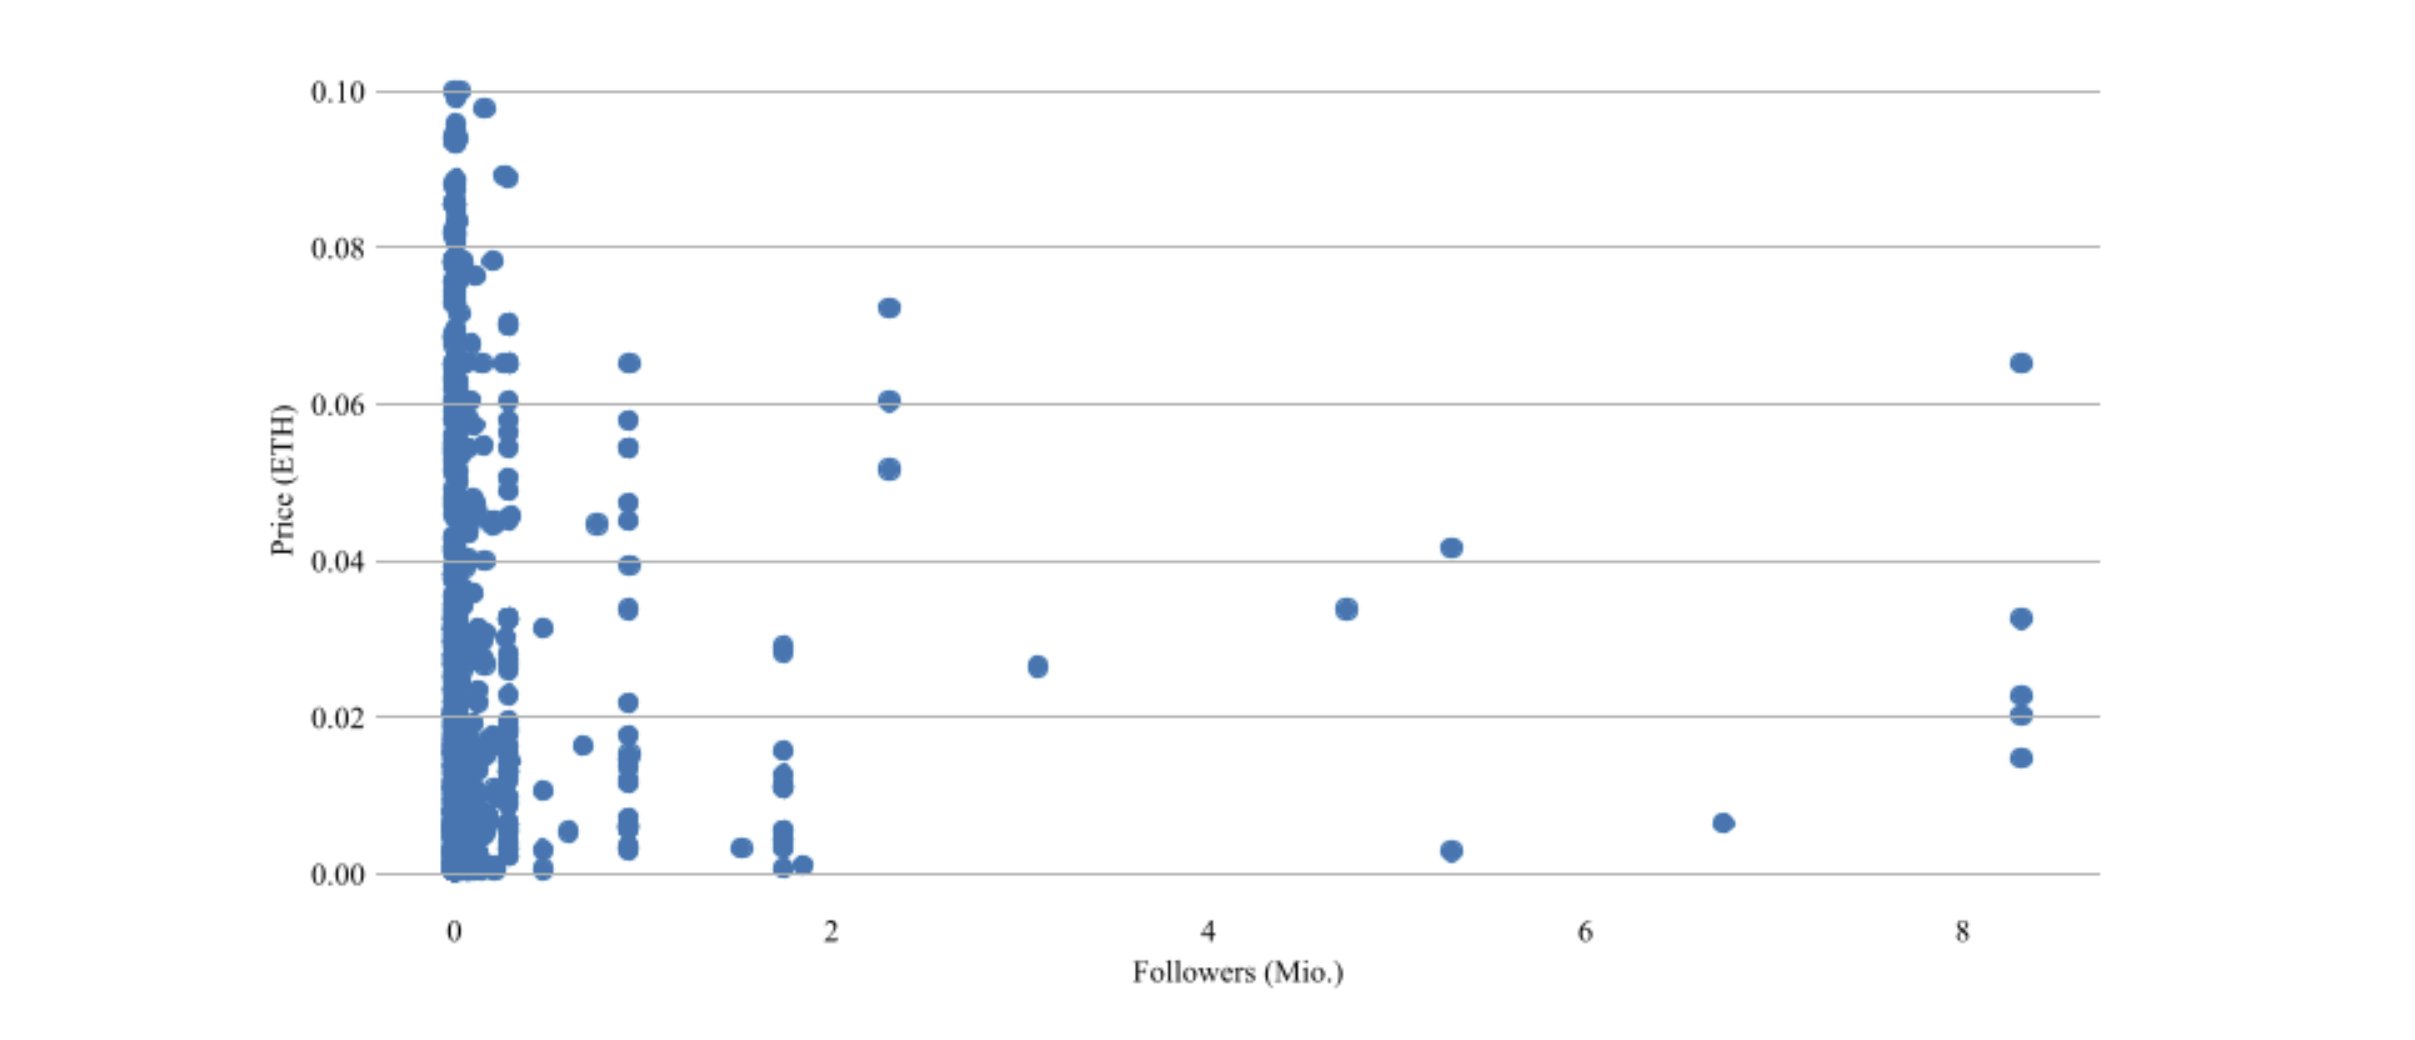
Figure7: Sale price (<0.1 ETH) vs. number of followers
Nonetheless, the matrix helps spot multicollinearity issues. On the one hand, Public lists and Followers are highly correlated and on the other hand, Tweet retweets and Tweet likes show a strong correlation with each other as well. Blindly throwing all available independent variables to the right-hand side of a regression equation will raise several issues, for instance, overfitting and statistical artifacts such as a high R-squared. Therefore, we have theorized what factors might have an impact on prices, given the information constraints of our data set. In essence, for the scope of this exploratory research on tweet NFTs and given the data limitations, we argue that sale price determination stems from two sources: user attractiveness and tweet attractiveness. These constructs will be proxied by simple indices. User attractiveness is a composite of Followers and Public lists and tweet attractiveness is a composite of Tweet likes and Tweet retweets. Due to skewed distributions, all original variables including Sale Price were logged prior to scaling them to make the values between variables comparable. Then the composite variables just represent an average of two transformed original variables.
Regression results
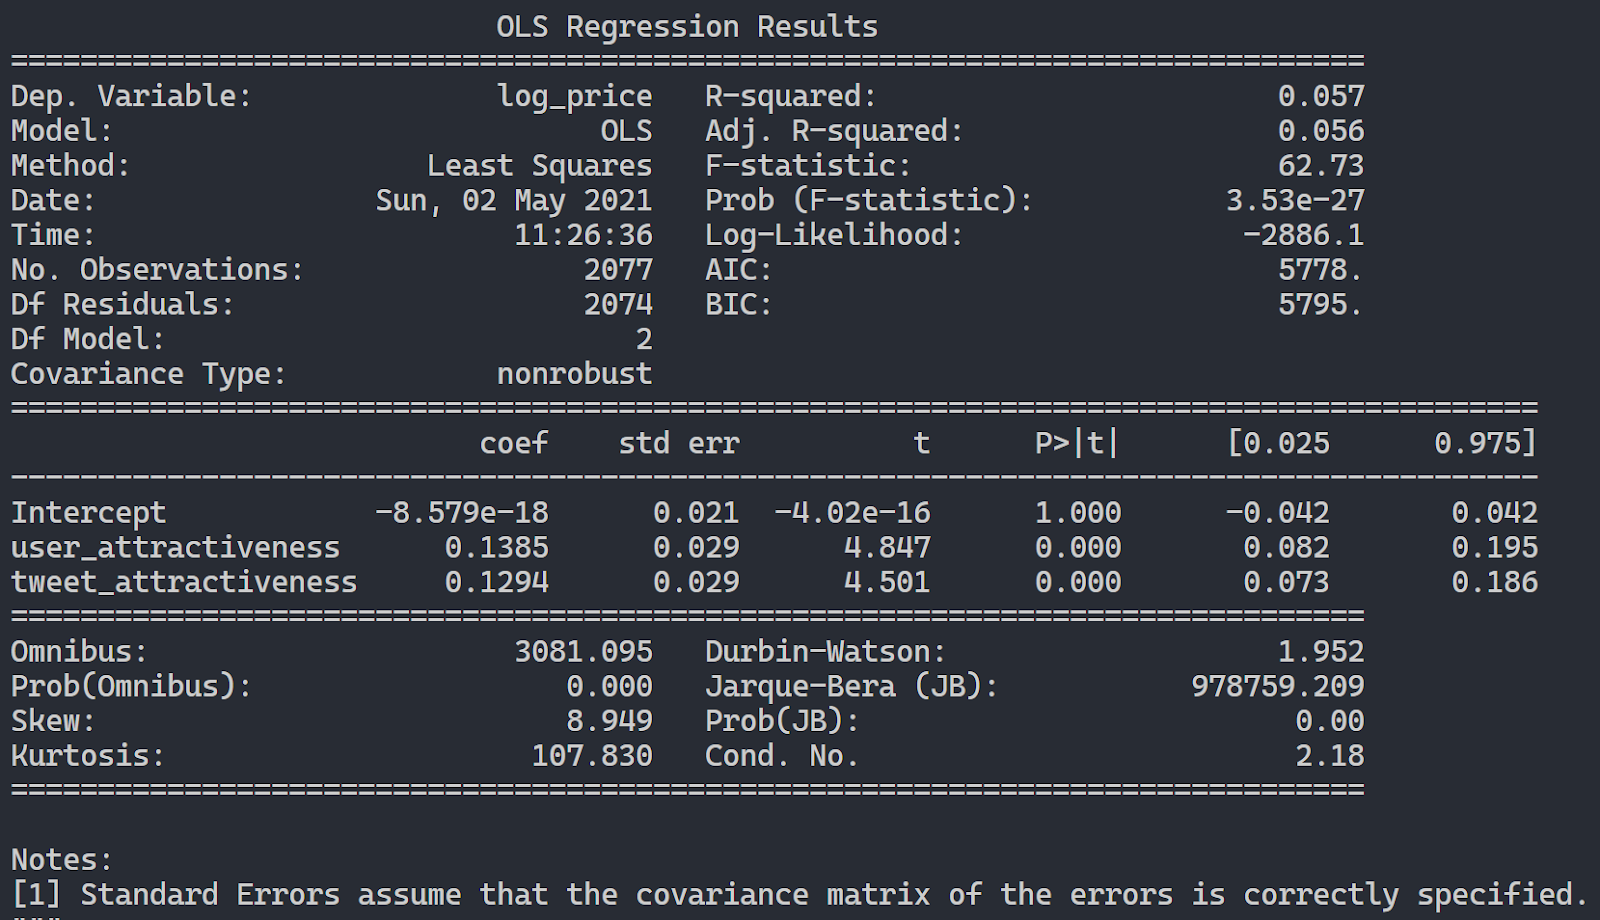
Figure 8: Regression results all sales (max removed)
Figure 8 tells us that our two independent variables’ coefficients are highly statistically significant and their respective confidence intervals do not cross the zero value, implying that the association is consistently positive. Unfortunately, barely 6% of the total variation in Sale Price was accounted for by this model.
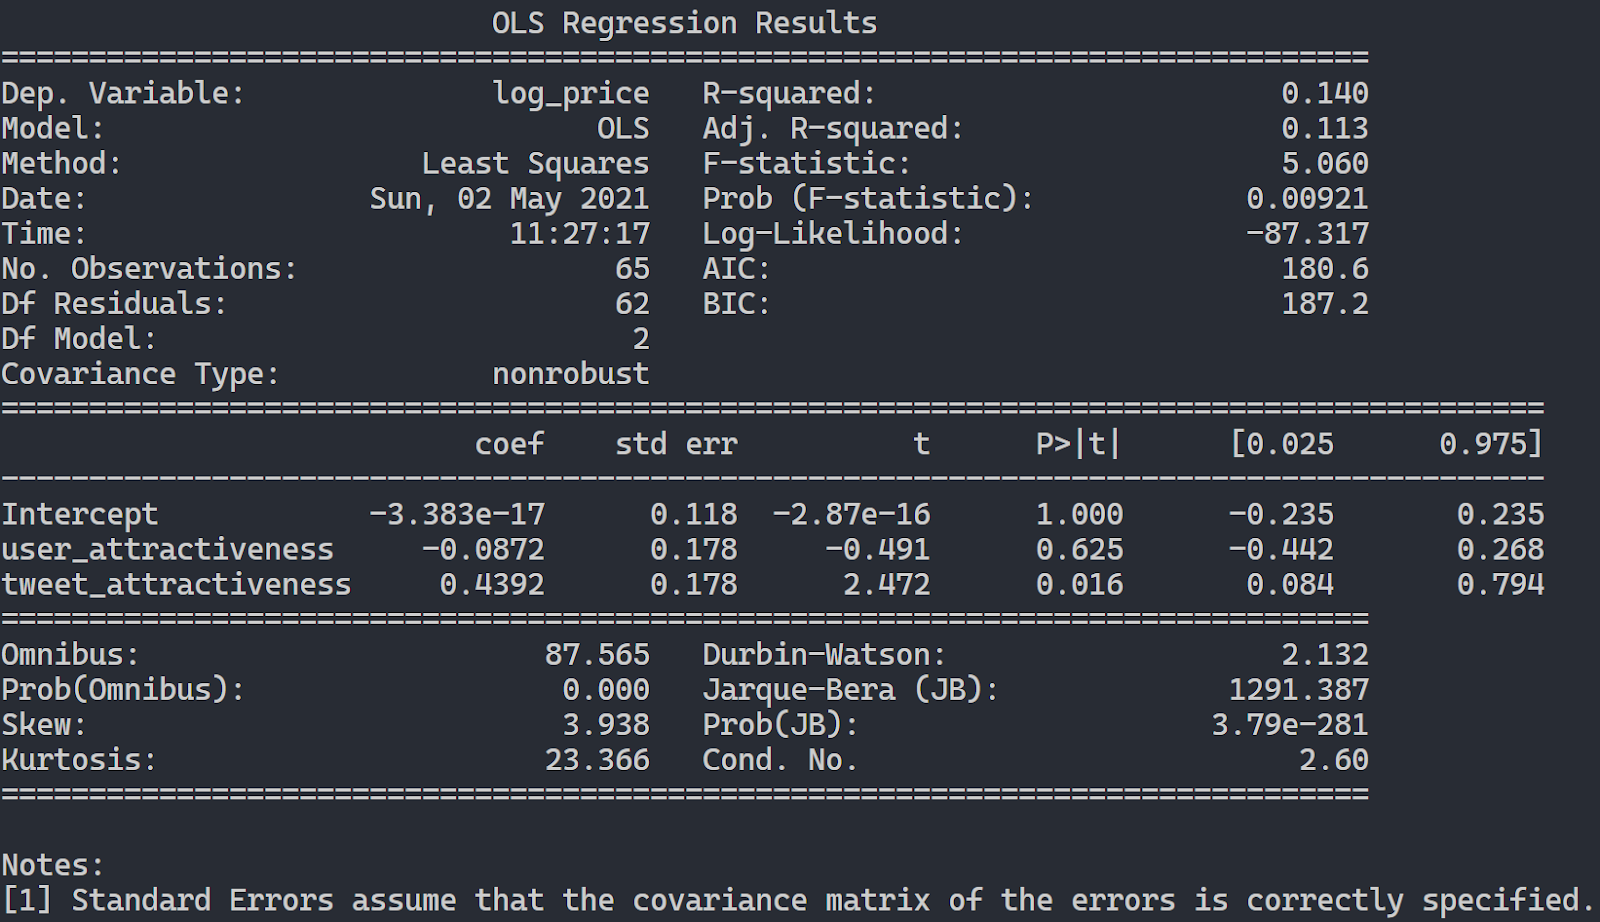
Figure 9: Regression results secondary sales (65 observations due to missing values)
Here we ran the same regression as above on the secondary sales data set. This time, the adjusted R-squared is higher at 11%. However, in contrast to the regression model earlier, user attractiveness’s coefficient is not statistically significant (and negative). This result implies that in the secondary market, only tweet attractiveness matters.
Conclusion
We have explained the rationale behind creating and trading tweet NFTs on marketplaces such as Valuables by Cent. More importantly, we have compiled a unique data set containing information on tweet NFT related events and have conducted a thorough analysis of this data. While there are other marketplaces besides Valuables by Cent, we argue that our data set is representative of the nascent tweet NFT marketplace due to Valuables by Cent’s prominence, partly owed to the attention-grabbing sale of Jack Dorsey’s first Twitter tweet on this platform.
We have found that price determination is difficult to quantify at this point. Our data set has not captured the information needed to predict sale prices with high accuracy. However, this is not surprising, given that the whole NFT market and the tweet NFT market, in particular, is still in its very infancy and given that price discovery is compounded by the fact that the market is very illiquid: There are still too few people understanding the concept of tokenization and NFTs and being comfortable with engaging with some of the technical prerequisites such as setting up a MetaMask wallet. Importantly, as aforementioned in the introduction, the intrinsic value of a tweet NFT will be very different for different potential owners. In a sense, they are the complete opposite of commodities, highlighting idiosyncratic properties and subjective valuations. For the current status quo, our best guess is that the bulk of tweet NFTs are minted, sold, and bought by people within the same group of acquaintances, wishing to have fun exploring this new technological offspring called tweet NFT. In case the market consolidates and provides more liquidity, other tweet properties such as image inclusion, tweet text length, and content information could be exploited within a price prediction machine learning framework. We have focused on sale prices but looking at bid prices might reveal itself as equally rewarding, shifting the focus on the willingness to pay. Future analysis might want to zoom in on specific tweet NFT trades, for instance, by identifying “celebrity” tweets (e.g. proxied by followers count and list inclusions). Differentiating between “celebrity” tweets and “normal” tweets could yield results along the line of comparing the artworks of “star” artists with “no-name” amateur artists. Investors might find it interesting to look specifically at “celebrity” tweets as the bulk of the art pieces available for sale have almost no monetary value and only famous art pieces fetch high prices and can act as an (appreciating) store of value.
These are preliminary findings taken from a snapshot of a very young market whose future will stay in the dark for some time. However, a boost could be waiting just around the corner if celebrities intensified endorsing the idea of marketing their tweet NFTs media effectively. For now, the question of whether tweet NFTs provide consumer value can only be answered on an individual basis.
Authors
Prof. Dr. Philipp Sandner has founded the Frankfurt School Blockchain Center (FSBC). In 2018 and in 2019, he was ranked as one of the “top 30” economists by the Frankfurter Allgemeine Zeitung (FAZ), a major newspaper in Germany. Further, he belonged to the “Top 40 under 40” — a ranking by the German business magazine Capital. Since 2017, he is member of the FinTech Council of the Federal Ministry of Finance in Germany. You can contact him via LinkedIn or follow him on Twitter (@philippsandner).
Christian Flasshoff has collected experiences in consulting and banking before breaking into the startup sphere. During his career, he has collected professional experience in the blockchain venture capital scene and other blockchain-related subjects. He enjoys solving problems with data science, writing code and developing technical solutions. You can contact him via LinkedIn.
Jong-Chan Chung is a venture developer at the Blockchain Founders Group (BFG) and a research assistant at the Frankfurt School Blockchain Center (FSBC). Before, he worked in economic research and business development, specializing in data analysis. He holds a dual Master’s degree in public policy from the Hertie School and the University of Tokyo. You can contact him via email (jongchan.chung@blockchain-founders.io) or LinkedIn.
Jan Steegmüller works as Research Lead for Blockchain Founders Group (BFG). He studies Banking and Finance at Frankfurt School of Finance and Management and studied at Stockholm School of Economics. Currently, he works on widespread projects around DLT and blockchain. You can contact him via email (jan.steegmueller@blockchain-founders.io) or LinkedIn.
Contact
BFG Blockchain Founders Group AG
Quaderstrasse 6, 9494 Schaan
Liechtenstein
www.blockchain-founders.io
Wolfgang Männel
wm@blockchain-founders.io

About Blockchain Founders Group
Blockchain Founders Group (BFG) is the driving force behind web3 innovation. As a company builder, we bring together a team of blockchain visionaries, experienced entrepreneurs, and industry experts, all committed to nurturing emerging talent. Our BFG acceleration programs serve as your springboard for launching blockchain startups, transforming concepts into reality in just 2-3 months. Each cohort develops 5-8 unique web3 ideas, and selected projects will be financially supported with 70,000 - 100,000 EUR, along with access to our extensive network. Join us in shaping the future of web3!
Stay updated by connecting with us on LinkedIn, Medium, Twitter, and YouTube.
Subscribe by email
Share this
NFTs: turning tweets into cash
Tweet NFTs: market overview - March 2021

No Comments Yet
Let us know what you think